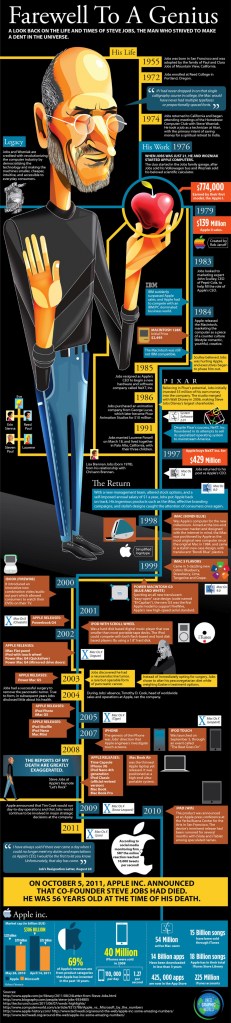
According to Creative digital, Remember the Steve Jobs memorial infographic? More than 2000 likes on Facebook, close to 1,500 retweets and over 500 LinkedIn shares. To say that the infographic went viral, is understating the appeal of that beautiful piece of creativity and genius.
Information graphics or infographics are what you see when you read maps, look at signs, enjoy a piece of journalism and learn more at school. It is a graphic representation of data, information, and knowledge and even statisticians, scientists and men of numbers use them to communicate their ideas more effectively. Infographics share complex information in rich, cutting edge pictorial, graphic depiction.
It is pretty much everywhere- manuals, road signs and media. You might think infographics are used in books for kids and you would be right, but you will also see them in books on science, filled as they are with astronomical diagrams and microscopic systems. Nowhere is it more apparent than a map with its landmarks and road network. And now it is on the internet.
Web designing is considered the hottest new trend this year. While the use of infographics is still in a nascent stage, a simple example of it on the net is in the animations that use Adobe Flash to bring information to you. What we see with web designing now is better creativity which means better colors, concepts, and a superior technology to power it all. Considering that the average customer takes 50 milliseconds to make up her mind about a site, it goes without saying that the website better delivers on content and appeal. Infographics create a responsive, fluid site which molds itself to suit the page dimensions it is displayed on. This highly interactive web designing trend is the future of this rapidly growing, always exciting market. The charm of the infographics lies in its user-friendly appeal. There is something almost cheerful about an infographic carrying information. The ease of understanding is so immense that even if the language used is unfamiliar to you, you can still follow the storyline.
Whether it is technical writing or publication, user manuals and guides, funny or hard-hitting messages, well-designed infographics means the client to your website stays that much longer- enough time for your message and values to be passed on and understood. It has wide appeal because the infographics can be put on Reddit, Twitter, StumbleUpon, Facebook and Digg- powerful social media sites. To be able to communicate, the message needs to convey in a simple form and infographics do just that. It is a powerful tool, so do allow it to cast its spell.
Source: https://www.creativ.com.au/emerging-trends-in-web-designing-infographics/
According to Coastal Creative, the design trends of 2021 are chaotic and imposing, throwing concepts like harmony and legibility to the wind. At a time when crisis has confined our movements and asked us to minimize risk-taking behavior, these 8 daring design trends are helping digital spaces expand the bounds of our imagination.
Here are the 2021 graphic design trends that offer an exciting vision of the New Normal:
- Responsive Clutter
- Surrealist Still Life
- Maximalism
- Outsized Typography
- Earth x Metal
- In-Text Photography
- Technodystopia
- Disharmonious Color Combos
Source: https://www.coastalcreative.com/design-trends/
Workshop Challenge:
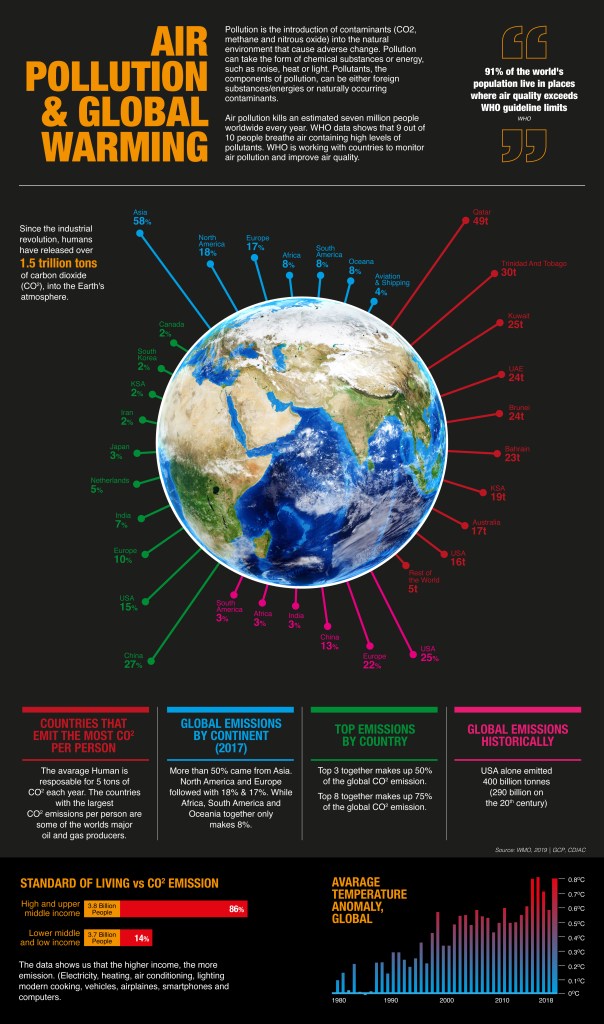
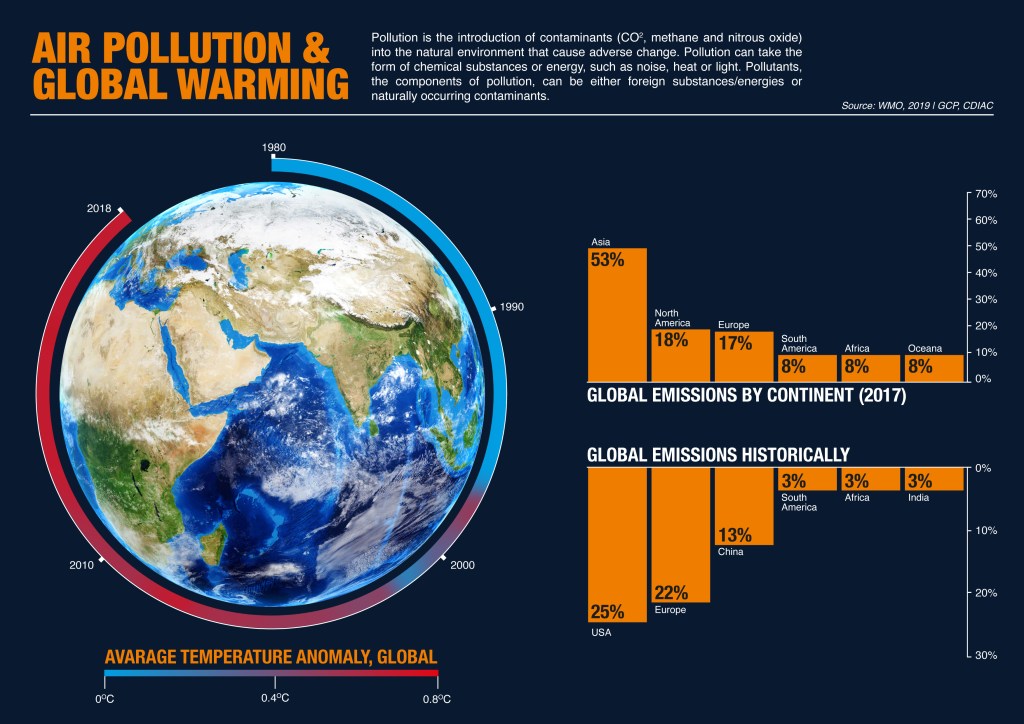
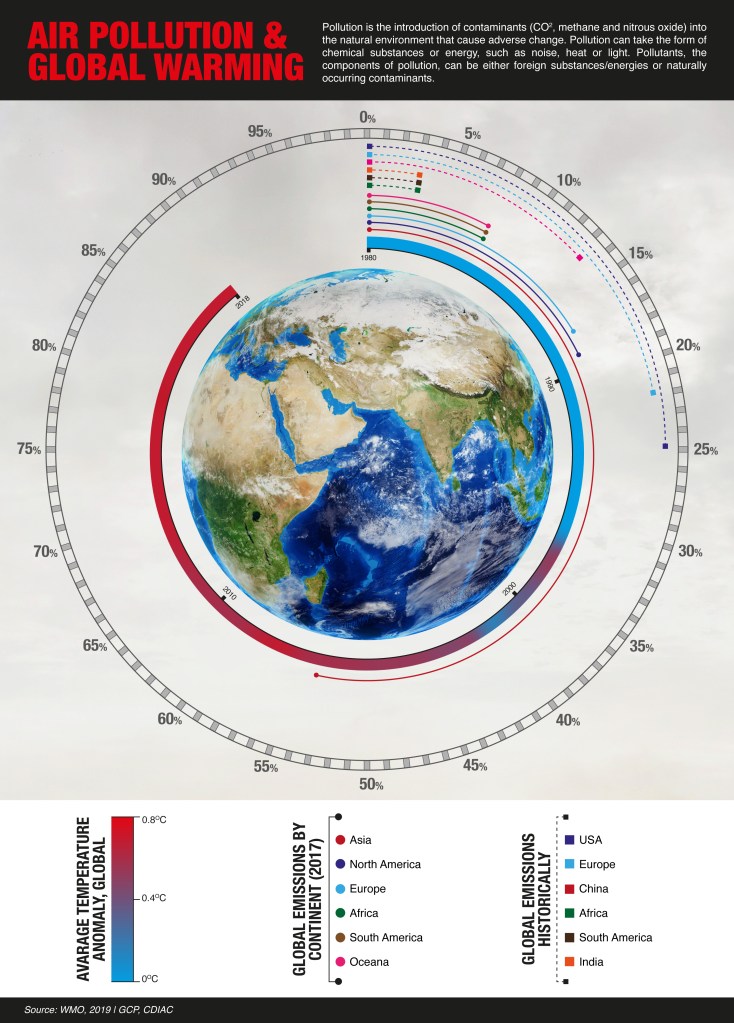
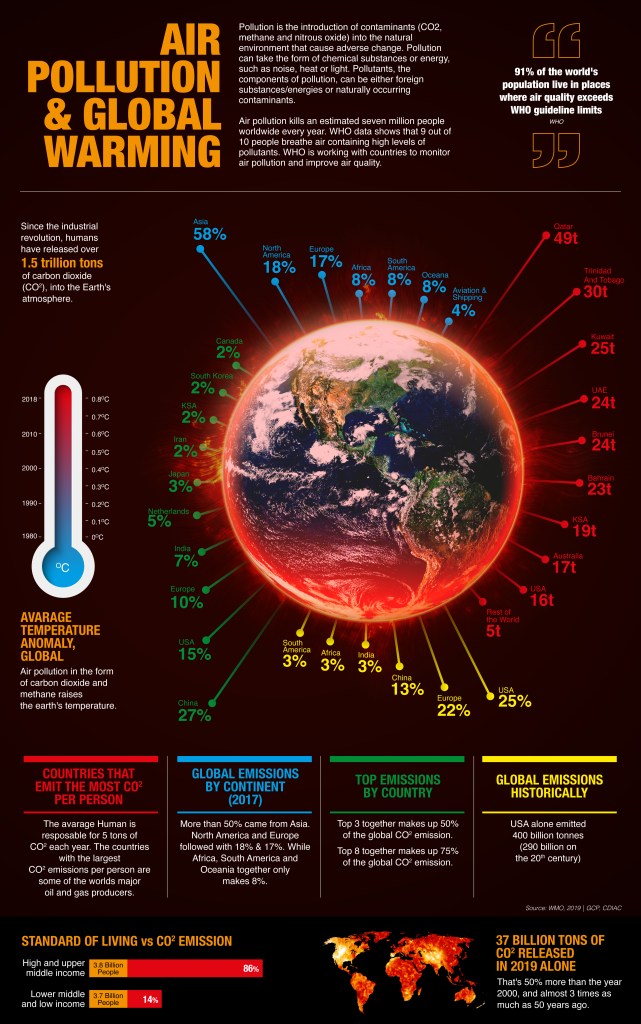
I am interested in the topic of reducing pollution in inner cities. I like topics about the environment and climate change. I usually read articles and watch YouTube channels on the same. I have decided to go back to a podcast I recorded in Week 6 – Module 2 where I interviewed an ex-colleague of mine and talked about Air Pollution.
Design Failures:
Final:
Omar Mal,
February 18, 2021
